U-signal
Introduction
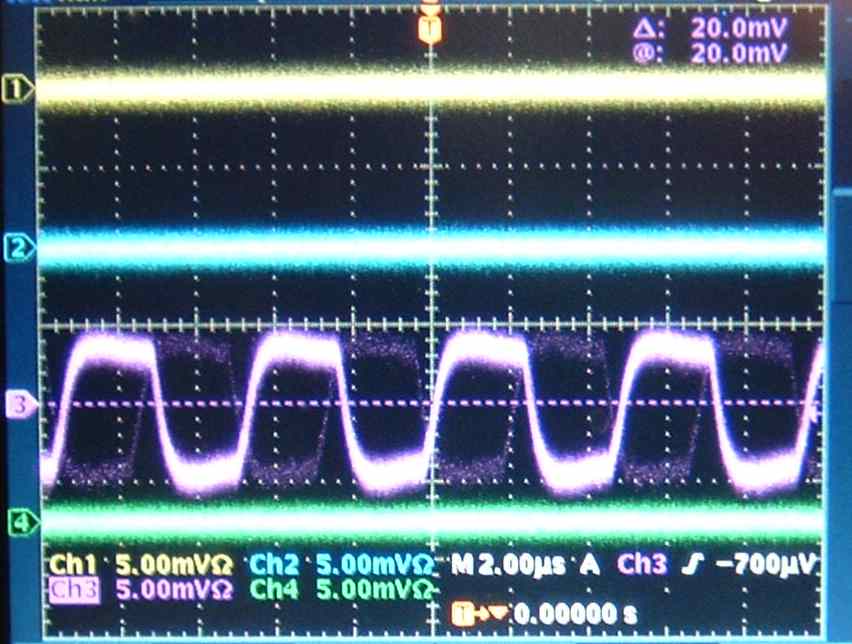
As it has been found recently an unknowing fraction of PbGl bases (presumably ~100)
reveals abnormal behavior. Such a base accidentaly starts to generate U-siganal (see pic.)
at PMT output. Parameters of this signal allow to say that it is internal base pulse used for
HV control. The reason why it is transmitted at PMT output is still unknown.
It was found that U-signal can be eliminated for a certain time by setting HV to 1000 V
and back to nominal.
Signal's magnitude is small as compared to physics signal, but at the same time U-signal is much
longer. Therefore then U-signal appears ASIC's input circuit capacitor is overflowed and no physics
signal can be retreived from this channel.
Channels having U-signal can be easily found using non-zero-suppressed pedestal data. As the capacitor
is continuously charging and discharging pre and post samples are absolutely outranged.
During physics running data is written on disk (and therefore can be analyzed) only if
HGpre-HGpost>threshold. It makes unaccessible most of events clearly
indicating on presence of U-signal. Only two reliable tests for U-signal remain:
- LGpre=0. It means that low gain is overflowed or too small.
All ASICs prior to Run5 were adjusted to have large enough pedestals, so it can be caused
only by U-signal
- HGpre-HGpost>400 Such a big value can be explained by PMT noise, cosmic particle, failed pedestal trigger or U-base.
As noted evidences are ambiguous occurence of several such events in a certain time interval is
equired to state presence of U-sinal in a given channel. Observations say that 3 events passing
any of these tests in 1000 sec interval are enough to designate the channel for U-treatment.
For that purpose automated procedure has been developed.
Author
A. Kazantsev 2.2005
stkav@rcf.rhic.bnl.gov
Description
The code consists of two parts. First one scan through pedestal events extracting from etpool
and finds indications of U-signal. Its output is stored in file log in
the following format:
<message number> <time in UNIX format> <meassage>
or
<message number> <number of channel> <meassage>
Example:
0 1107566691 MSG_PED_EVENT
1 1869 MSG_HIGH_SIGNAL
2 2067 MSG_OVER_HG_PRE
3 3711 MSG_OVER_HG_PRE
4 1107566692 MSG_LED_EVENT
This file is read and analyzed by other part of code. If more than 3 indicator events occured in past
1000 seconds this code treats given module. Output of this code is stored in file
log2 in the following format:
<channel number> <time in seconds since t0> <meassage>
Example:
3711 497028 MSG_OVER_HG_PRE
226 497186 MSG_OVER_HG_PRE
974 497186 MSG_HIGH_SIGNAL
974 497230 MSG_CURED
Macro utilyzing etpool often fails so crontab is used to keep it always alive.
Crontab executes two tasks:
- Every 15 minutes checks if the process is alive. If not it restarts it and add message to
logfile.txt
- Every day it kills the process and starts it again and add message to
logfile.txt
To trace found signals and treated modules use root -l trace.C
Code repository
/home/phnxpbgl/stkav/Usuppression
Instruction
To start pedestal scan from very beginning:
[phnxpbgl@va009] ~> cd /home/phnxpbgl/stkav/tmp/build/
[phnxpbgl@va009] build> make install
[phnxpbgl@va009] ~> cd /home/phnxpbgl/stkav/Usuppression/
[phnxpbgl@va009] Usuppression> ./restart.sh
To start pedestal scan with tty output:
[phnxpbgl@va009] ~> cd /home/phnxpbgl/stkav/tmp/online/monitoring/Run3/macros/
[phnxpbgl@va009] macros> source setup_onlmon.csh
[phnxpbgl@va009] macros> root -l 'run_emcal.C("etpool")'
To start treatment code:
Make sure that it is not running. If it is alive kill it.
[phnxpbgl@va009] Usuppression> ps -aux|grep Ukiller
phnxpbgl 18854  0.0  0.1  3296  844 pts/11   S    15:11   0:00 root -l Ukiller.C
phnxpbgl 18855  1.8  4.6 41608 23756 pts/11  R    15:11   2:04 /opt/phenix/root/bin/root.exe -splash -l Ukiller.C
phnxpbgl 24687  0.0  0.0  1620  496 pts/11   S    17:01   0:00 grep Ukiller
[phnxpbgl@va009] Usuppression> kill -9 18854 18855
After that:
[phnxpbgl@va009] ~> cd /home/phnxpbgl/stkav/Usuppression/
[phnxpbgl@va009] Usuppression> nohup root -l -q Ukiller.C >&NULL&
To start it with debug output:
[phnxpbgl@va009] ~> cd /home/phnxpbgl/stkav/Usuppression/
[phnxpbgl@va009] Usuppression> root -l -q Ukiller.C
To look at found evidences and treated modules:
[phnxpbgl@va009] ~> cd /home/phnxpbgl/stkav/Usuppression/
[phnxpbgl@va009] Usuppression> root -l trace.C
Last update:
Andrey Kazantsev