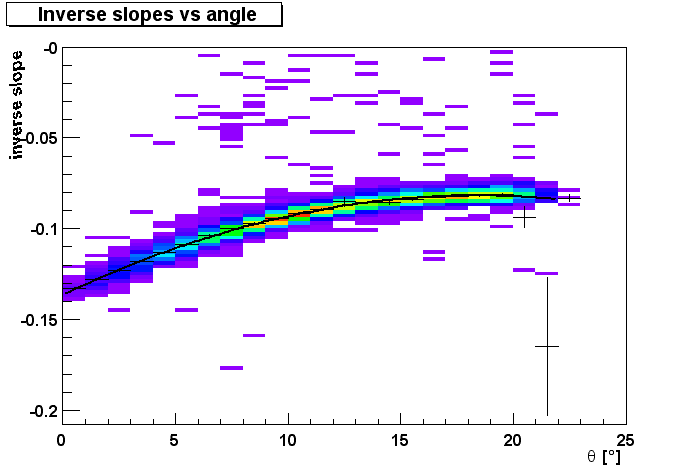
 Inverse slopes versus angle of incidence.
The Basic Idea behind the slope method is that in a first
approximation the energy measured in each module has the same
exponential distribution.
By determining the slope s_i for each module and the mean
slope <s> for all modules one can now derive a
factor <s>/s_i to correct the energy scale in a way
that all modules show the same slope. This has to be done in several
iterations by determining a new mean slope for each set of corrections.
The energy deposition is not independent of the angle of incidence,
because the electromagnetic showers of particles with larger angles
spread over more modules. This effect is illustrated in the picture
below.
Inverse slopes versus angle of incidence.
The inverse slope instead of the slope has been chosen because the inverse slopes show a more symmetric distribution than the slopes itself. That allows to fit a gaussian to extract the mean value after correcting for the angular dependence.
The code used for scanning the PbGl tower information is found here (The root macro which does the fitting of the slopes, the angular correction etc. might be useful, too).
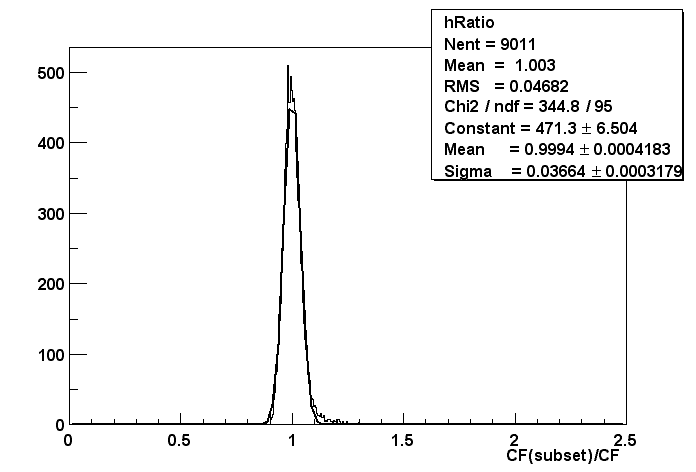
A cross check for the reliability of the slope method is to compare the correction factors for different run periods. As a starting point a sample of about 24M minimum bias events from the second AuAu run was used. This sample has been subdivided into different sets of 2.4M, 4.8M and 12M sequential events. Correction factors has been determined from each of the subsets and compared to the correction factors from the whole set. The comparison is done by dividing the correction factor of a certain module from the subset analysis by the correction factor obtained by looking at the whole set. The distribution is well descrbed by a gaussian as can be seen here, where the correction factors from the first 2.4M events is compared to the factors determined over the whole run period.
The mean value of the distribution shows how strong the overall energy-scale changes depending on the selection of different sets, while the sigma provides insight on the fluctuation of the energy scale in each module. Looking at the pictures below one can clearly see that the overall energy scale is preserved better than 1 %, while the relative calibration on a module by module basis is obviously improving with the size of the subset and always better than 4%.
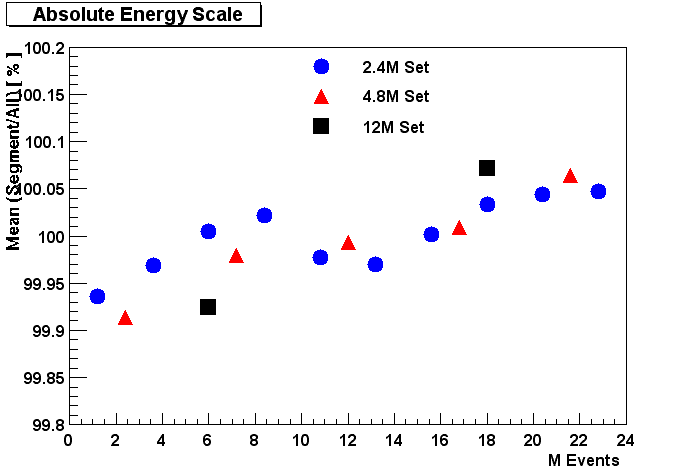 Fitted mean values of the ratio of correction factors from subset and whole set.
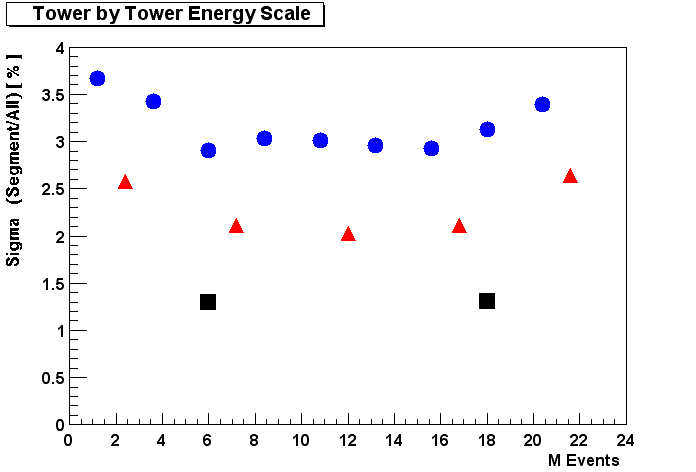 Fitted sigma values of the ratio of correction factors from subset and whole set.