HVDP: High Voltage Display Program
Ryan Roth
Pager: (516) 402-4739
Email: rothr@db.erau.edu
This page describes the look and use of the High Voltage Display Program,
a program which uses a ROOT-generated GUI to choose information from a
Objectivity database and display that information in the form of graphs
or histograms.
Contents
-
Program Description
-
HV Database Description
-
The Command Window -- Plotting
-
The Command Window -- 1D Histogram
-
The Command Window -- Graph
-
The Command Window -- 2D Histograms
-
The Command Window -- Histogram Options
-
The Canvas Window
Program Description
HVDP is executed by typing HVDP on the command line. This
causes the program's two windows to appear. One of these (the smaller one)
is the command window, where the user can select what information to plot
and what style to present it in. The other window is the canvas window,
where the graphics are drawn. By default, the program initially opens a
database called "DEMO" upon executing. If another database is desired,
the program will accept the first command line argument as the initial
database name (i.e., typing 'HVDP -db EMCAL' will cause the program
to load the database named EMCAL initally). The program also accepts
a -cf flag, which can specify an initial configuration file, in this manner:
HVDP -cf EXAMPLE1.DPC. (The program uses configuration files
to define the type and style of the multiple plots that can be drawn to
the canvas window.)
HVDP 'loads' a database by opening the database and creating
a list of all the channels present there which have readbacks. Readbacks
are objects which record voltage, current, demand voltage, status, and
enable status, together with a timestamp. HVDP organizes the readbacks
for the selected channel into a list structure, which is then used to build
the appropriate histogram or graph. The user can select one or more of
the viable channels from the first list box in the command window.
The selections appear in the second list box, and can be removed from there
by clicking their names in the second list box When more than one channel
is chosen, the drawing canvas is split into separate, smaller areas known
as pads when the "Draw!!" button is pressed.
The actual drawing does not occur until the user clicks the "Draw!!"
button, which is located along the bottom of the command window.
The plot types and styles are determined by the current configuration.
The user can change the configuration by loading a configuration file (with
a .DPC extension) from the menu bar, or by modifying an existing configuration.
Modifying an existing configuration is simple -- merely select which pad
you wish to modify via the slection box at the bottom of the command window.
Then select the type of plot you wish this tab to have via the second selection
box. Then switch to the tab which has the same name as the plot type
and modify its parameters there. If you are making a histogram, you
might also modilfy the ranges found on the tab "Histogram Options."
Everytime you change a value, the existing configuration gets updated.
You can save the configuration for later via the "Save Configuration.."
option under "File" on the menu bar.
These ROOT-based drawing routines have shown themselves to be sensitive
to other window programs, especially Netscape. By this I mean that, if
Netscape or another GUI-based program is running when HVDP is executed,
then HVDP may not be able to display certain colors (Netscape has
a well-known habit of 'eating' the color-maps). In particular, the histograms
which use the surface or shading options can look very strange. You can
resolve this by closing other GUI applications before executing HVDP.
I have also noted some strangeness involving plots having the "Smooth Curve"
option, which may cause them to not be drawn correctly when many plots
have this option.
Database Description
HVDP links with an Objectivity database which contains High Voltage
information. The program expects the database to have a certain structure;
if a database with a different structure is used, it is likely that the
program will not be able to plot anything.
The High Voltage databases we use consist of several containers, one
for each LeCroy High Voltage Module type that we use in PHENIX. Inside
these containers are placed HV module objects. When a module object is
created, the database software automatically creates the appropriate number
of HV channel objects in the same container. These channel objects are
linked to the module object with Objectivity associations. Each channel
object has associated with it a HV setpoint object, which contains default
information for HV settable variables, such as demand voltage and ramp
rates. In a similar way, each HV channel object has associated with it
a Readback container, where HV readback objects for that channel will be
placed. Whenever the database software receives an instruction to store
a readback, a HV readback object is created and placed in that channel's
readback container. The Readback containers are named using the following
convention: "Readbacks_X", where X is the name of the channel that this
readback container is associated with. HVDP accesses these readback
containers to find plottable information.
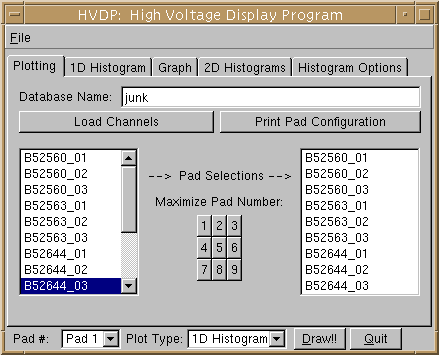
The Command Window -- Plotting
The first tab in the command window provides the user with a way of changing
the database being examined and quickly changing which set of channels
are selected. After typing in a new database name, pressing 'Enter' in
that text field or hitting the 'Load Channels' button will cause the program
to examine the new database for plottable channels and list the acceptable
ones in the list box. A new channel is selected simply by clicking its
name in the list box, which causes it to appear in the second 'draw set'
list box. It is possible to select a channel more than once, and
thus see its information in different plots and styles. There is
also a "Print Pad Configuration" button, which prints the current configuration
to standard output. Since, when many channels are selected, the plots
can be difficult to see, there has been added an additional 'Maximize'
feature. To get a larger image of a plot, click the corresponding
numbered button in the middle of this tab. This will cause a new
canvas to be created, with the correct plot drawn to it by itself.
Note that these buttons can only be pressed immediately after hitting the
"Draw!!" button, since to do otherwise would possibly create a larger image
of an old plot style. The program imposes a limit of nine channels
that can be plotted at once -- this could be changed, with some effort,
but this is not recommended since having more shrinks the plots, making
them hard to see and possibily causing program errors.
Here is a picture of the first tab:
The Command Window -- 1D Histogram
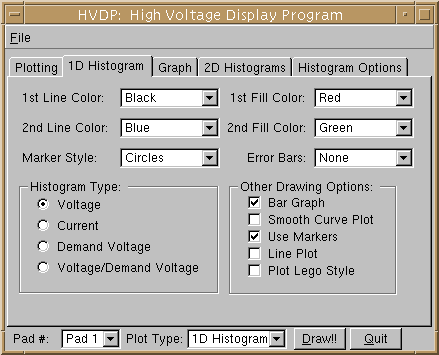
This tab allows the user to select options for the one-dimensional histograms
drawn by pressing the 'Draw Histogram' button. The radio buttons control
which aspect of the readbacks are plotted (voltage, current, etc.) The
last radio button allows the user to overlay the demand voltage information
on top of the voltage information for comparison. The check boxes allow
the user to select specific drawing options such as drawing a striaght
or smooth line between points, drawing bar-graph style bars, or displaying
the information as a lego plot. This tab also contains combo boxes which
can change the color of the fill areas and lines drawn, change the marker
styles, or use an error bar option.
Here is a picture of the second tab:
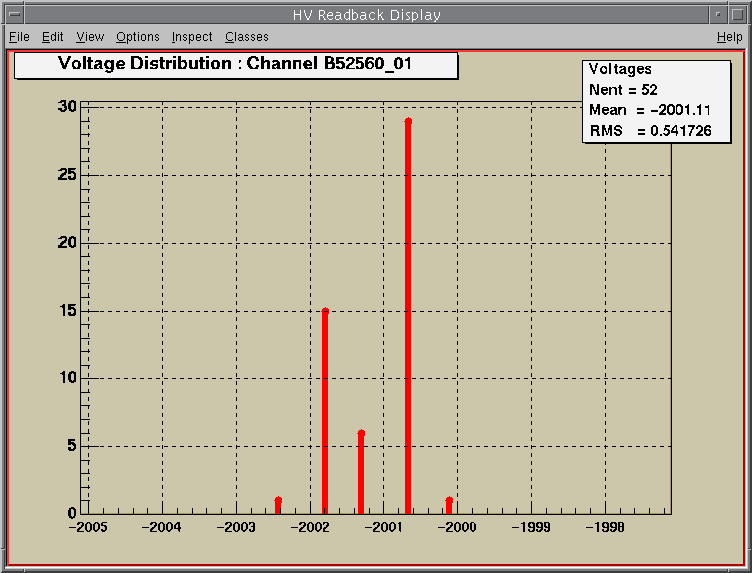
A typical Voltage histogram is shown here (default colors -- the canvas
has been resized to present it easily here):
The Command Window -- Graph
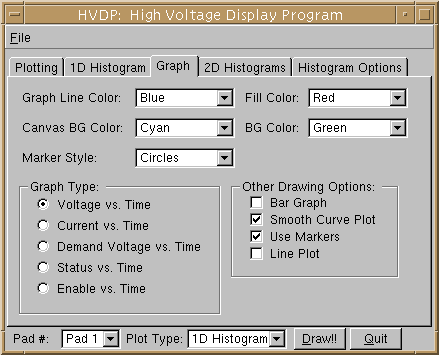
This tab is very similar to the previous one, except that it controls the
options used to draw graphs. Colors and marker styles are selected with
combo boxes; what to graph is selected with radio buttons; check boxes
select other drawing options. The resulting graph is plotted against time
in minutes.
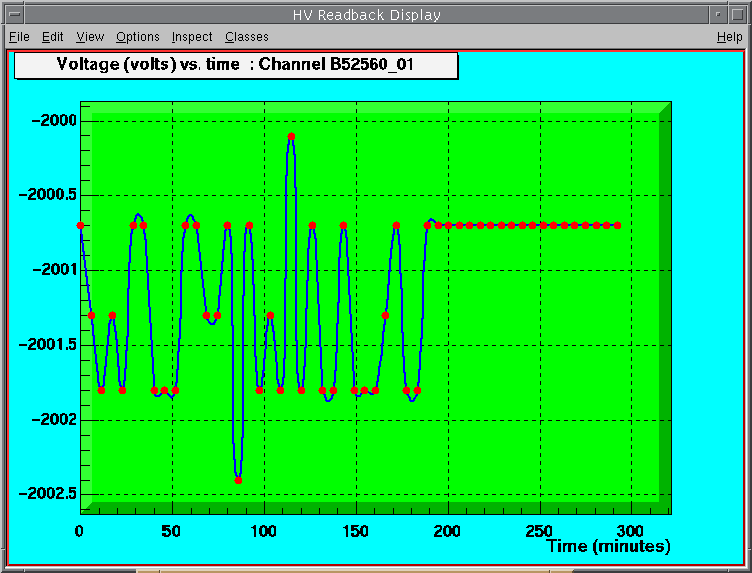
Here is a picture of the third tab:
A typical Voltage Graph is shown here (default colors-- the canvas has
been resized to present it easily here):
The Command Window -- 2D Histograms
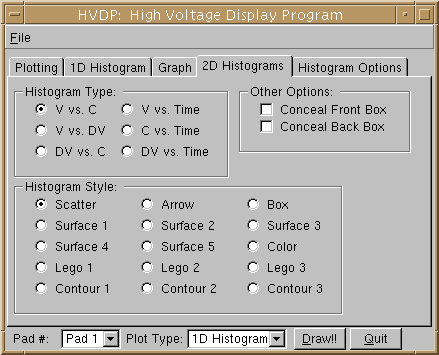
The 2D histograms drawn with the 'Draw 2D' button are controlled from here.
The user can select one of six different 2D plots, and one of 15 different
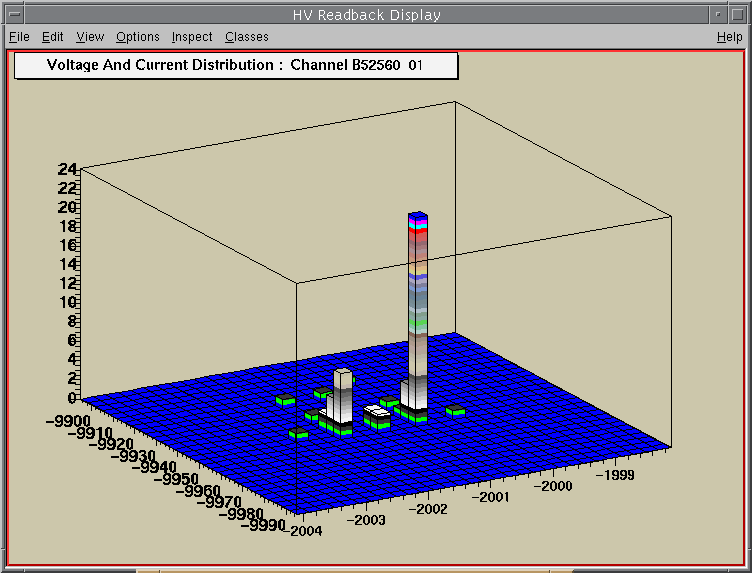
plot styles. Surface and Lego plots are drawn inside a wire-frame cube
-- the user can remove all, half or none of this wire-frame by clicking
one or both of the check boxes found here.
Here is a picture of the fourth tab:
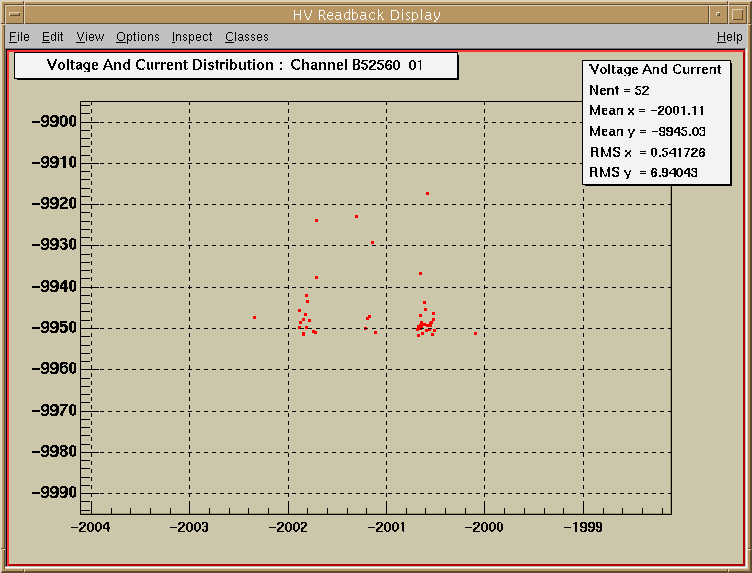
Here is a picture of a (default-- the canvas has been resized to present
it easily here) Scatter plot:
Here is a picure of a Lego 3 plot:
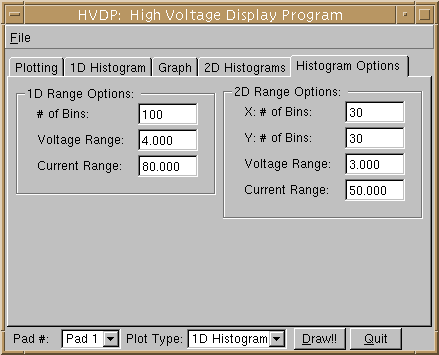
The Command Window -- Histogram Options
This window holds the text fields which control the 1D and 2D historgram
ranges and bins. The program displays every histogram as centered on its
mean value; the values plotted will extend from the (mean-Range) to (mean+Range).
Naturally, the ranges for voltages and currents are distinct. For the DEMO
database, these values are set to 1000.0 V for voltage ranges and 5000.0
microamps for currents. If you use the command line option to load an alternative
database, these values will change to 4.0 V and 50.0 microamps, respectively.
However, if you allow the DEMO database to load, and then change the database
from tab 1 (Plotting), you may have to alter these text fields to be able
to view the histogram. In case you are wondering, the Graph option automatically
sizes itself around the data, so you need not provide values for its range.
The DEMO database has it's own .DPC file (DEMO.DPC) which holds its
enlarged ranges and is automatically loaded if DEMO database is allowed
to load.
Note: it is usually a good idea to keep the number of bins in 2D histograms
small, because a large number of bins there slow down the program and make
the histogram more difficult to read, usually without providing any additional
resolution that is helpful.
Here is a picture of the fifth tab:
The Canvas Window
This is the drawing area. It remains blank until one of the three drawing
button is clicked. When a button is pressed, the designated channel information
is drawn to the canvas. The user can manipulate the objects on the canvas,
moving or resizing text boxes, for example. When using Lego or Surface
options, the user can rotate the plot by clicking and dragging the wire-frame
box. When a new channel is selected in the tab 1 (Plotting) list box, the
canvas does not automatically redraw -- the draw button must be pressed
again.
Recently, ROOT 2.20.06 was installed on the machines in the PHENIX counting house.
When operating/compiled under this version of ROOT, this program has an
added feature: Zoomable Axes. This means that the user can use the mouse to
focus a Graph or Histogram axis onto a narrower area. This is done by left-clicking
the axis, and dragging the mouse to create a zoom-in area. Releasing the mouse
button causes the program to recalculate the plot, using the marked area as the
new borders. This feature allows the user to quickly adjust the plot to make it
more readable. However, zooming-out is more difficult, in that you must extend the
marked area past the edge of the plot. It is usually easier just to redraw it in
this case, or to adjust the range via 'Histogram Options.'
At the top of the Canvas window is a menu bar. This is the standard
menu bar ROOT attaches to a Canvas window. There are several options here,
most of which are not very useful to this program's goals. However, there
are a few which might prove useful to you.
-
File -- Under the File option, you can save the canvas as a .gif,
.ps, .eps, or even a .root file.
-
Edit -- You can add notes or clarifications to the graph by selecting
the 'Editor' option (Note that, by right-clicking an object in the canvas,
you can examine and make changes to its attributes, such as font size,
color, etc.). You can also clear the canvas with 'Clear Canvas' (oddly
enough).
-
View -- The 'Color' option lets you see the different colors that
the program uses. This is a good place to look if your histograms look
strange -- if you don't see 50 different colors -- (number 10 is white)
than you probably have another GUI that is eating part of the color map.
You can also look at the different marker styles under 'Marker' (HVDP
uses 5 of these styles).
-
Options -- The most useful things here are the ability to turn off
and on the the Histogram/Graph Title bar and the Histogram Statistics box
with 'Histogram Title' and 'Statistics', respectively.
Unless you want to play with the ROOT Browser option, the Inspect
and Classes Menu options are not too useful. The usefulness of the
Help option is, of course, debatable.
Here is a picture of the canvas when nine channels have been selected,
with various styles:
Multiple Plots
Here is a picture of an expanded pad:
Expanded Pad
Here are some links to pictures developed using some 'standard'
configurations:
1D Histograms
Graphs
2D Histograms
Follow this link to download the source code file.
Last Modified: 9 June, 1999


